Notebook séance 12
%load_ext sql
%config SqlMagic.dsn_filename = "connections.ini"
%sql --section bd-pedago
%sql --connections
import pandas
import matplotlib.pyplot as plt
import matplotlib as mpl
Connecting to 'bd-pedago'
%%sql
select * from dfj
Running query in 'bd-pedago'
9594 rows affected.
| index | Subject | Name_A | Name_B | Dist_A | Dist_B | Mode | Space | Side | Response | RT | juste |
|---|---|---|---|---|---|---|---|---|---|---|---|
| 0 | P_ADI_331 | 0 | 2 | 2 | 4 | Dic | E | D | 2 | 18865 | False |
| 1 | P_ADI_331 | 1 | 4 | 4 | 1 | Dic | E | D | 2 | 13157 | True |
| 2 | P_ADI_331 | 4 | 3 | 3 | 2 | Dic | E | D | 1 | 11628 | False |
| 3 | P_ADI_331 | 2 | 4 | 4 | 1 | Dic | E | D | 1 | 10068 | False |
| 4 | P_ADI_331 | 1 | 2 | 2 | 4 | Dic | E | D | 1 | 11801 | True |
| 5 | P_ADI_331 | 2 | 1 | 2 | 3 | Dic | E | D | 2 | 12117 | False |
| 6 | P_ADI_331 | 2 | 1 | 3 | 4 | Dic | E | D | 1 | 16347 | True |
| 7 | P_ADI_331 | 0 | 3 | 2 | 4 | Dic | E | D | 1 | 13237 | True |
| 8 | P_ADI_331 | 2 | 0 | 4 | 2 | Dic | E | D | 2 | 12589 | True |
| 9 | P_ADI_331 | 2 | 1 | 4 | 2 | Dic | E | D | 2 | 10973 | True |
%%sql
with diff_dist as
(SELECT *, ("Dist_A" - "Dist_B") as dd
 from dfj)
select dd, juste, avg("RT")
from diff_dist
group by dd, juste
Running query in 'bd-pedago'
16 rows affected.
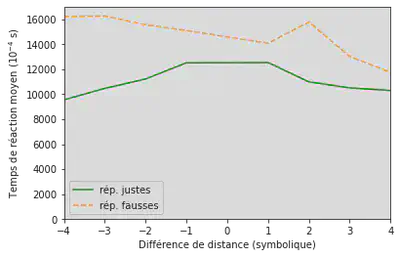
| dd | juste | avg |
|---|---|---|
| 2 | False | 15788.223048327138 |
| 1 | True | 12531.617410387710 |
| -4 | False | 16226.410256410256 |
| -4 | True | 9553.0997732426303855 |
| 2 | True | 10986.662393162393 |
| -2 | True | 11214.590833333333 |
| -1 | False | 15092.825127334465 |
| 4 | True | 10295.532438478747 |
| -3 | False | 16255.831932773109 |
| -3 | True | 10463.882282996433 |
%%sql
select ("Dist_A" - "Dist_B") as dd, juste, avg("RT")
from dfj
group by dd, juste
Running query in 'bd-pedago'
16 rows affected.
| dd | juste | avg |
|---|---|---|
| 2 | False | 15788.223048327138 |
| 1 | True | 12531.617410387710 |
| -4 | False | 16226.410256410256 |
| -4 | True | 9553.0997732426303855 |
| 2 | True | 10986.662393162393 |
| -2 | True | 11214.590833333333 |
| -1 | False | 15092.825127334465 |
| 4 | True | 10295.532438478747 |
| -3 | False | 16255.831932773109 |
| -3 | True | 10463.882282996433 |
dfs = %sql select ("Dist_A" - "Dist_B") as dd, juste, avg("RT") from dfj group by dd, juste
Running query in 'bd-pedago'
16 rows affected.
dfg = dfs.DataFrame()
dfg
| dd | juste | avg | |
|---|---|---|---|
| 0 | 2 | False | 15788.223048327138 |
| 1 | 1 | True | 12531.617410387710 |
| 2 | -4 | False | 16226.410256410256 |
| 3 | -4 | True | 9553.0997732426303855 |
| 4 | 2 | True | 10986.662393162393 |
| 5 | -2 | True | 11214.590833333333 |
| 6 | -1 | False | 15092.825127334465 |
| 7 | 4 | True | 10295.532438478747 |
| 8 | -3 | False | 16255.831932773109 |
| 9 | -3 | True | 10463.882282996433 |
| 10 | 3 | False | 13009.027272727273 |
| 11 | -2 | False | 15560.310924369748 |
| 12 | -1 | True | 12509.724812030075 |
| 13 | 1 | False | 14076.217785843920 |
| 14 | 3 | True | 10506.656470588235 |
| 15 | 4 | False | 11753.484848484848 |
sj = (dfg[dfg["juste"]]
      .set_index("dd")
      .sort_index()
      ["avg"]
     )
sf = (dfg[~dfg["juste"]]
      .set_index("dd")
      .sort_index()
      ["avg"]
     )
fig, ax = plt.subplots()
ax.set_xlabel("Différence de distance (symbolique)")
ax.set_ylabel("Temps de réaction moyen ($10^{-4}$ s)")
ax.plot(sj, label="rép. justes", color="green", linestyle="-")
ax.plot(sf, label="rép. fausses", color="orange", linestyle("--"))
ax.axis([-4,4,0,17000])
ax.legend()
None
Documentation matplotlib: https://matplotlib.org/stable/users/explain/quick_start.html